(August 2021 – March 2023)
Authors: I-Miao Chen, Pin-Yu Yeh, Ya-Chu Hsieh, Ting-Chi Chang, Samantha Shih, Wen-Fang Shen, Chiun-Li Chin
Journal Paper in Heliyon Journal: https://doi.org/10.1016/j.heliyon.2023.e14242 Published: March 02, 2023
Below is a condensed version of the actual paper.
Introduction
The voice is used in many aspects of life, but is often not paid enough attention to. High pressure in life, lack of sleep, smoking, and alcoholism may all cause damage of the vocal cords and even the lesions of the vocal cords, leading to problems with daily life, such as communication problems due to the inability to speak normally or vocal cord incompetence due to vocal cord atrophy or paralysis, which further leads to difficulty swallowing. Severe cases may even result in death.
Contribution
In this paper, we split the video laryngoscope into a sequence of images and input them into the 3D VOSNet deep learning architecture. In addition to the interpretation of a single image, 3D VOSNet also adds sequence information, so the model can learn the feature information of the before and after sequence images to achieve translation and occlusion invariance, which indicates that our model can segment and classify each object in the sequence of laryngoscopy not affected by external factor such as shaking or blocking during laryngoscope. This architecture can more accurately segment the vocal cord area of the larynx.
There is no objective system for analyzing data related to vocal cords in video laryngoscopes sequence images in clinical examination. In addition to using the model to segment the laryngeal region, this study also combined the laryngeal identification algorithm. The algorithm can be used to calculate six X-indicators including vocal cords length, vocal cords area, vocal cords curvature, vocal cords length deviation, glottal area, and vocal cords symmetry. The above indicators can assist otolaryngologists in staying credible and objective when making decisions without any doubt during diagnosis and also explaining the clinical symptoms of the larynx such as vocal cord paralysis to patients after diagnosis.
Research / Related Works
Artificial intelligence has been widely used in various fields. In order to use deep learning to calculate the vocal cords and glottal indicators, we conducted a series of literature reviews to construct the method proposed in this paper.
In 2020, Matava et al. [[16]] used convolutional neural networks such as ResNet, Inception, and MobileNet to instantly classify images captured by laryngoscopes and bronchoscopes as vocal cords and trachea. They then compared the three models and found that the models with the best classification performance were ResNet and Inception. Their specificity reached 0.985 and 0.971, respectively, and their sensitivity was 0.865 and 0.892, respectively. However, both ResNet and Inception were only able to detect approximate locations and were unable to label the contours of actual vocal cords.
In the same year, Ren et al. [[17]] classified laryngoscopy images as normal vocal cord tissue, vocal cord nodules, vocal cord leukoplakia, benign polyps, and malignant tumors by the ResNet-101 model. ResNet-101 model recognized normal vocal cord tissues and different types of vocal cord diseases with an accuracy rate of over 90%. However, the ResNet-101 model could not effectively identify the lesion when the image was occluded.
In 2018, Xu et al. [[18]] believed that the long-term learning of temporal and time-series features of the model was very important for the analysis of many videos. Therefore, they segmented objects from sequential images using an LSTM architecture to extract temporal and spatial features in videos. According to their research data, the method could get more accurate than the other method that segmented objects from a single image. However, this model did not perform well when the target object and the background color got similar. To put it another way, it is difficult to segment the target area.
In 2019, Duarte et al. [[19]] presented the CapsuleVOS semi-supervised learning model to segment objects from videos. The model segmented the location of video objects through the characteristics in the sequence images of the video and extracted contextual information from the video. According to the paper, their proposed method performs well in the situations of segmenting small objects and objects being blocked. Nevertheless, this model did not perform well in segmenting the edge of the object when the object was moving or offsetting, and the target was often not completely segmented.
In the same year, Kao et al. [[20]] proposed a novel and effective method to segment brain tumors. This method generated heatmaps from different types of brain tumor lesions in the MNI spatial coordinate system established by brain MRI, which were then used to create Volumes-Of-Interest (VOI) maps. Finally, the VOI map and the multi-modal MRI image were input into the 3D UNet model to segment the brain tumors. The experimental results showed that the method proposed by Kao et al. could effectively segment brain tumors. It is proved that if the features of the lesion can be fused and the 3D UNet model is used, the lesion can be effectively segmented from the sequence image. However, this method is only applicable to the lesion with an MRI image taken.
In 2020, Xiao et al. [[21]] developed a 3D Res2U Net combining 3D UNet with Res2Net for segmenting lung nodules in CT images. It was mentioned in the experimental results that 3D Res2UNet has a powerful multi-scale feature extraction capability, which enables 3D Res2UNet to find more subtle features of lung nodules in CT images. In addition, the recall value is 99.1% and the Dice coefficient index is 95.3%. It turns out that the accuracy of detecting and segmenting lung nodules using 3D Res2UNet gets better than using UNet or 3D UNet alone. However, they only conducted experiments of 3D UNet combined with Res2Net and did not discuss experiments combined with other residual networks for feature extraction.
In 2021, Yang et al. [[22]] proposed the MSDS-UNet model to segment lung tumors in CT images automatically. They used the model to segment sequence images of lung slices and efficiently segmented lung tumors with contextual information about the slices. Compared with traditional medical image segmentation algorithms, the effectiveness and superiority of this method are demonstrated. The segmentation result is not affected by the similar color of the target to the background or the movement of the target.
In 2016, Çiçek et al. [[23]] presented a 3D UNet model that only needs to be trained with a small amount of labeled data. The model was used to segment the kidney in Xenopus biomedical images, and the segmentation results of the 2D U-Net model and the 3D UNet model were compared. It was mentioned in the paper that 3D UNet has the characteristic of preserving the information of contextual images, while 2D U-Net only treats all labeled images as independent images. Therefore, it is found from the experimental results that the average IoU of 3D UNet is 0.863 and the average IoU of 2D U-Net is 0.796, indicating that the performance of 3D UNet gets better than that of 2D U-Net.
In the 18th and 19th centuries, many scholars proposed relevant research that can be used for the evaluation of vocal cord, as well as important indicators that can be used for the evaluation of changes in lesions. Omori et al. [[24]] proposed a method to measure the glottal area. The standardized glottal area was obtained by dividing the glottal area by length squared of the vocal cords, which can be used as a related indicator of the vocal cords. Moreover, Woodson et al. [[25]] mentioned that measuring the glottal angle can reflect unilateral vocal cord paralysis, deviation ratio, and polarization of the paralyzed side vocal cord. Finally, the glottal angle can be calculated as a basis for vocal cord diagnosis has also been proposed in the paper. Casiano et al. [[26]] showed that the expansion of the vocal cord tumor will increase the failure rate of subsequent operations. Therefore, the vocal cord area can be used to estimate the success of vocal cord tumor surgery.
In 2020, Cho et al. [[27]] used the CNN architecture to classify the images captured by the laryngeal endoscope and to extract the subtle and important information from the images through the deep learning model to assist the otolaryngologists in their diagnosis. In the same year, the diagnosis of speech disorders depends on a large extent of the experience of otolaryngologists. Zhang et al. [[28]] used a machine learning approach to calculate the geometry, toughness, position, and subglottic pressure of vocal cords. The calculated data can effectively assist otolaryngologists in the clinical diagnosis of vocal cord diseases.
In 2017, Bonilha et al. [[29]] discussed a few studies that are related to the commonly used indicators for diagnosing the larynx to assess sound disturbances caused by abnormal vocal cords. It is found that the six parameters such as the magnitude of glottal gap, mucosal wave amplitude, location or shape of glottal gap, regularity of vibration, phase symmetry, and presence and size of specific lesions are the most commonly used to evaluate the therapeutic effect of vocal cords. However, the proposed larynx-related parameters were not further defined in this paper.
In addition, the problem of gradient vanishing may occur when extracting context information in time-series images. Therefore, according to 2021, Zhou et al. [[30]] studied the differences between the results of using ResNeXt, Res2Net, and ResNet to verify the identity of speaker in different environments and sentence lengths. They demonstrate that ResNeXt and Res2Net can still effectively identify the identity of the speaker in noisy environments, and the recognition results are not affected by differences in sentence length. Moreover, Xie et al. [[31]] in 2017 proposed ResNeXt network architecture for image classification. The network constructs a module and multiple modules of the same architecture based on this module. Then they aggregated multiple modules into the same and multi-branch network architecture, which can extract multi-scale features.
Based on the above literature review, it can be concluded that the 3D UNet can utilize contextual information in the sequence image for learning the distinctive features of the target object in the succeeding frames to accurately segment the object area. If the position of the object offsets, it will not affect the segmenting effect of the model. Therefore, it confirms the goal of this paper to segment laryngeal objects in video laryngoscopy can be reached by using 3D UNet. Next, ResNeXt has excellent results in classifying target objects regardless of whether it is on natural images or time-series data. ResNeXt utilizes a feature extraction network that combines the residual network and Inception structure. It not only avoids overfitting and improves computing efficiency, but also extracts features at multiple scales. Therefore, this paper refers to the 3D UNet and ResNeXt architectures and uses ResNeXt in the 3D UNet encoder network to extract the subtle features in the successive sequence images of the video laryngoscope to improve the accuracy of 3D UNet segmentation of the vocal cords and glottal. Finally, there is not a standardized system in clinical examinations for data analysis pertaining to vocal cords in video laryngoscopes sequence images. Hence, this paper aims to propose the analysis algorithm for video laryngoscopes to assist otolaryngologists in medical diagnosis and improve the quality of medical care.
Materials and Methods
The computational implementations were performed with the library Keras and run on the computer with 16GB RAM, i9-9900X CPU, and NVIDIA Quadro RTX5000. The rest of this section is the introduction of the laryngoscopy dataset, the annotation of data, the 3D VOSNet model, as well as the self-build indicators calculation algorithm we adopt.
Dataset
The dataset used in this paper is a publicly available “Quantitative Laryngoscopy” dataset [[27]], which is consist of a total of 50 video laryngoscopes. The video laryngoscopes may vary in brightness and blurriness because of different photography angles or shaking of the photography equipment. Therefore, the method of adjusting the sharpness and contrast of the images to augment the dataset was used in this paper to avoid overfitting due to an insufficient training dataset. Fig. 1 shows the contrast and sharpness-adjusted image. There are a total of 250 video laryngoscopes after augmentation. Each video laryngoscope is about 10 s. The video was captured at 30 frames per second (fps), so each video laryngoscope was captured 256 images for a total of 640000 images. Finally, 80% of the dataset is used for model training, and the remaining 20% is used to evaluate the accuracy of the model.
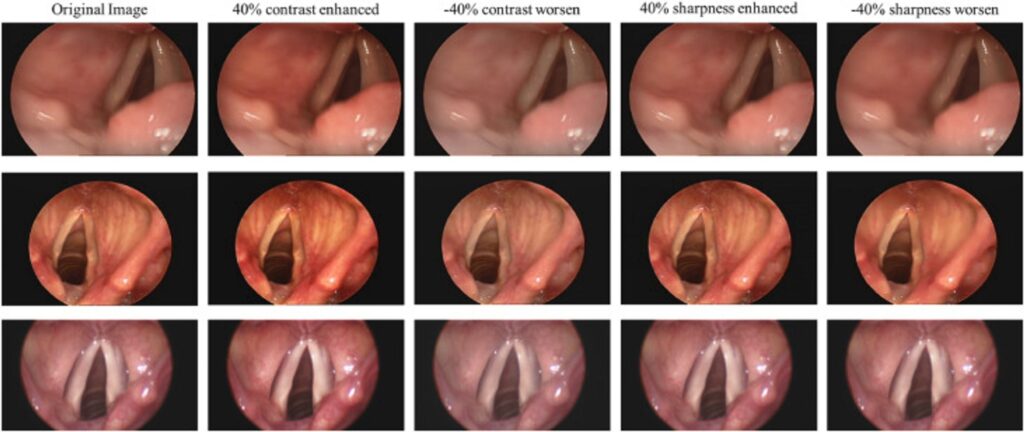
Fig. 1 The contrast and sharpness adjusted images: the first column shows the original images; the second column shows the images with enhanced contrast by 40%; the third column shows the images with worsened contrast by 40%; the fourth column shows the images with enhanced sharpness by 40%; the fifth column shows the images with worsened sharpness by 40%.
Data Annotation
In this paper, the objects in the laryngeal endoscopy images are divided into four categories: left vocal cords, right vocal cords, glottal, and background, as shown in Fig. 2(a). Thus, APEER was used in this paper to annotate different types of objects in the laryngeal endoscopy images that have been converted into grayscale images. Meanwhile, different types of objects would annotate with different grayscale values. After using the APEER to annotate, the image of the mask with the same size as the original image will be generated, as shown in Fig. 2(b).
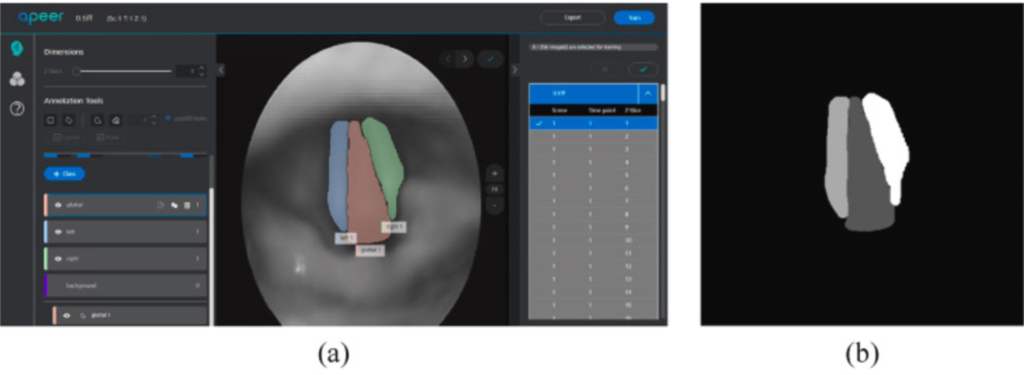
Fig. 2 (a) an image annotated using APEER and (b) an image of mask generated by APEER.
Model Selection
It is easy to expose or blur the image due to the photography angle caused by the doctors operating the equipment or the movement of the vocal cords. Since the video laryngoscopes are composed of sequence images, it contains the state during the vibration of the vocal cord. To segment larynx objects of the image sequence without misjudgment due to the offset caused by vocal cord vibration or personal factors, the 3D VOSNet model was used to retain the contextual information between the previous image and the next image. On the other hand, segmenting the laryngeal objects with the 3D VOSNet not only focuses on the feature of the specific image but also refers to the feature of previous three images and next three images of the specific image. Therefore, the contextual information, which is 3D information means the image containing time-series characteristic. The 3D VOSNet comprised an encoder and decoder. The architecture diagram of 3D VOSNet is shown in the beige region of Fig. 3. Both contain a 7 × 7 × 7 convolutional layer, which is possible to extract features from the image sequence, 4 Convolution Blocks, 16 Identity Blocks, and a fully connected layer used for classifying segment area. The Convolution Block is an Inception structure that includes 65 convolutional layers of 1 × 1 × 1 and 32 convolutional layers of 3 × 3 × 3, as shown in the blue region in Fig. 3. The Identity Block is an Inception structure combined with a residual block, which contains 64 convolutional layers of 1 × 1 × 1 and 32 convolutional layers of 3 × 3 × 3, as shown in the green region in Fig. 3. The difference between the Conv Block and the Identity Block is that there is a convolutional layer in the shortcut path of Conv Block. In the backbone, ResNeXt was adopted to combine the Inception structure and the residual block of ResNet to extract multi-scale features without gradient vanishing. The overall architecture of 3D VOSNet is shown in Fig. 3.
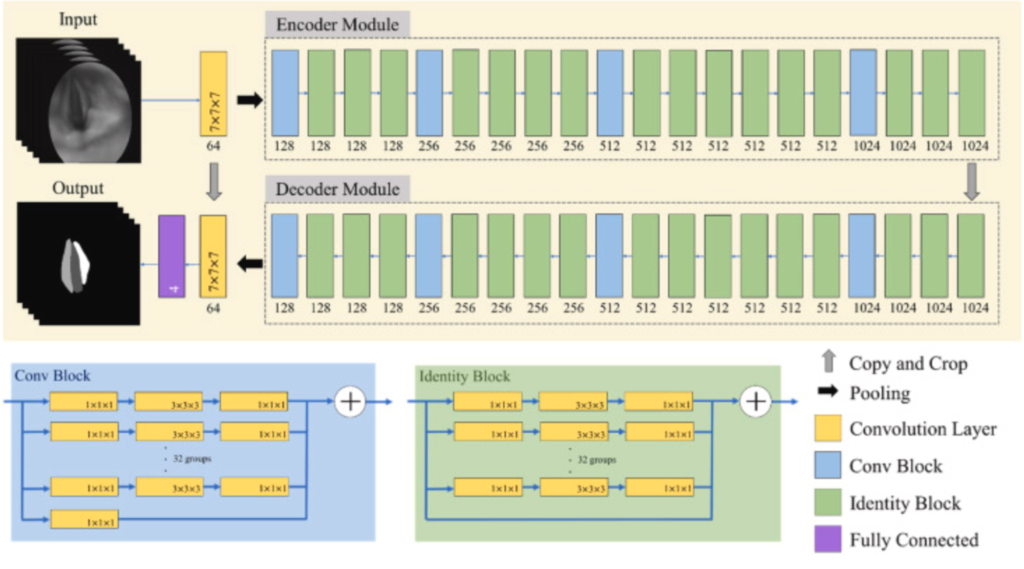
Fig. 3 The 3D VOSNet architecture diagram.
Loss Function
During the training process, Dice Loss and Categorical Focal Loss were used to evaluate the performance of the model. Dice Loss is mainly to evaluate the target area, which means it can improve the imbalance problem between foreground and background. Therefore, Dice Loss can be used to calculate the similarity between the areas of the left vocal cord, right vocal cord, and the glottal in the prediction results of ground truth and 3D VOSNet to evaluate the training effect of the model. Combining Categorical Focal Loss and Dice Loss avoids gradient change drastically due to the prediction error of the proposed model occurring in the training stage. Categorical Focal Loss set a larger weight for the complex background in the laryngeal endoscopy image to strengthen the training. Compared with Dice Loss, Categorical Focal Loss considers the targeted areas, including the right vocal cord, the left vocal cord, and the glottal, in addition to the background. The combination of Categorical Focal Loss and Dice Loss can make the change of the loss function more balanced. The detailed algorithm of the architecture is shown in Algorithm 1.
Indicator Calculation
The larynx objects segmented by the 3D VOSNet model were used to calculate the relevant indicators of the vocal cords through our proposed method to facilitate subsequent examination of diseases or treatments.
Left and right vocal cords curvature
Length of the arc of the upper vertex, the lower vertex, and the geometric center of the segmented vocal cord region, divided by the value of the radius of the circumcircle from these three points to understand vocal cord atrophy, paralysis, and the nerve condition of the larynx. If the calculated vocal cord curvature is close to 0, it indicates atrophy or paralysis of the lateral vocal cord. On the contrary, a high calculated vocal cord curvature indicates normal vocal cord movement.
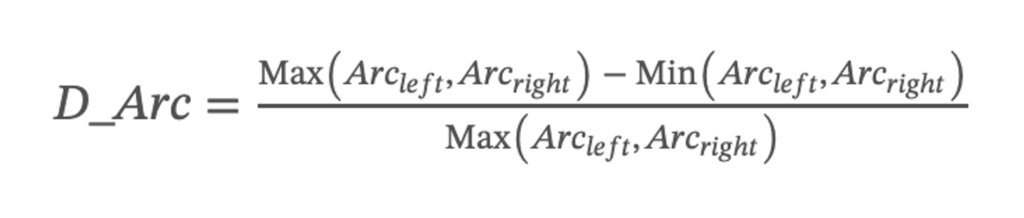
Deviation of vocal cords length
In clinical examination, understanding the symmetry of the length of the left and right vocal cords can help judge whether there is paralysis or polyps in the vocal cords. In order to calculate the deviation of the lengths of the left and right vocal cords, first their difference is obtained. Secondly, to divide the difference by the maximum length of the vocal cords to obtain the ratio, then add the absolute value, and finally output the average the deviation of vocal cord. The closer the value of this index is to 0, the higher the symmetry of the vocal cords on both sides. The deviation of vocal cord length was calculated using the following:
Deviation of vocal cords area
The symmetry of the area of the vocal cords can obtain whether the laryngeal lesion area has expanded, such as the expansion of the laryngeal cancer area. Therefore, the difference between the left and right vocal cords is divided by the maximum area of the vocal fords to obtain the ratio, and then output the average of the deviation vocal cord area. The deviation of vocal cord area was calculated using the following:
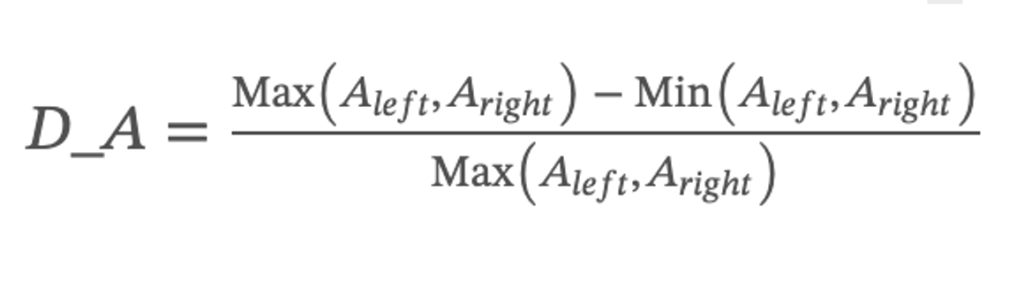
where Aleft denotes the sum of all pixels in the segmented left vocal cord region and Aright denotes the sum of all pixels in the segmented right vocal cord region.
Glottal area
Calculating the size of the glottal area can determine whether the vocal cords have incomplete closure. In this paper, the area of the glottal segmented by the model was calculated by Green’s formula [[33]]. When the glottal area is 0, the glottal is completely closed. When the glottal is closed but the area of the glottal is not equal to 0, the glottal may not be completely closed due to paralysis or atrophy. The formula for the glottal area is as follows:
where n represents the number of vertices in the irregular area of the glottal segmented by the model; x and y represent the coordinates of each vertex.
Glottal angle
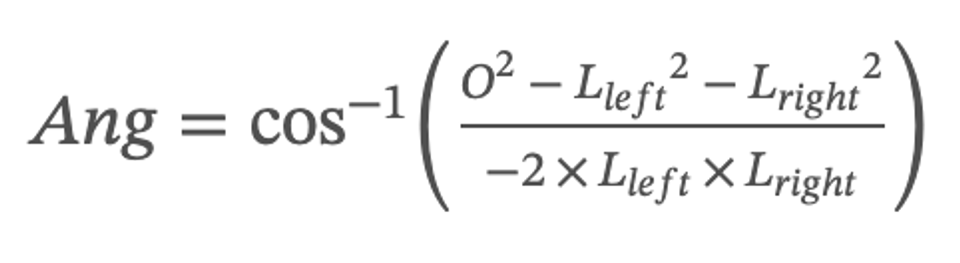
This paper defines the angle formed by the upper top of the left and right vocal cords and the lower top of the glottal as the glottal angle. This indicator can evaluate the closure status of the glottal. When the glottal is closed but the value of the glottal angle is not equal to 0, the vocal cords are not closed completely. The formula for the glottal angle is as follows:
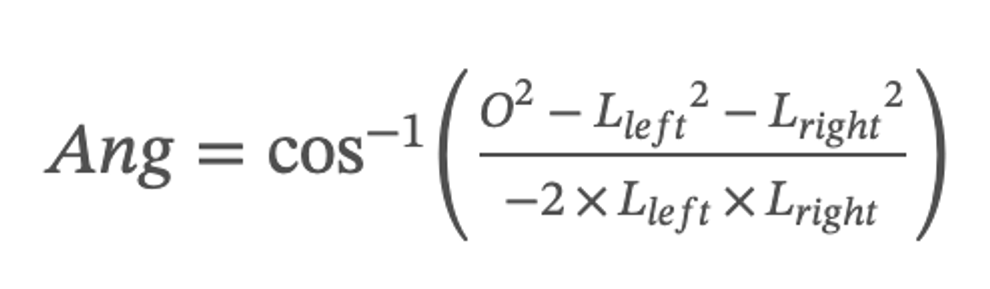
where O stands for the length of the length of the connection between the two upper vertices of the left and right vocal cords, Lleft stands for the length of the connection between the upper vertices of the left vocal cords and the lower vertices of the glottal, and Lright stands for the length of the connection between the upper vertices of the right vocal cords and the lower vertices of the glottal.
Symmetry of vocal cord
The distance between the center point of the vocal cords and the midline position of the glottal can determine the state of movement and symmetry of the vocal cords during vibration. The equation of the symmetry of vocal cords in vibration is shown below. When the symmetry value of the vocal cords in video laryngoscopy is close to 0, the vocal cords can be closed down entirely; otherwise, the vocal cords are not closed completely.
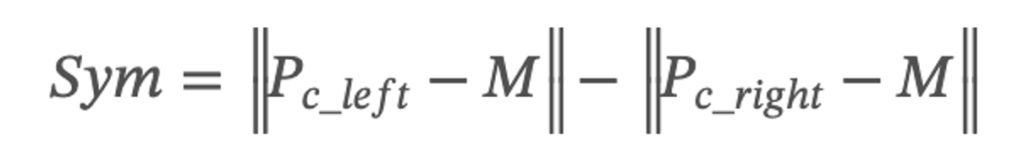
where Pc_left means the center position of the left vocal cord, Pc_right means the center position of the right vocal cord, and M means the midline position of the glottal.
Results
To verify the feasibility of the classification models, the testing datasets are tested. Fig. 4 can be observe that 3D VOSNet can effectively segment objects regardless of the opening and closing of the vocal cords and the blocking status. However, it is easy to have the wrong labeling when there are black shadows in the image due to the wrinkles of the throat tissue, or there are noises in the image during photographing.
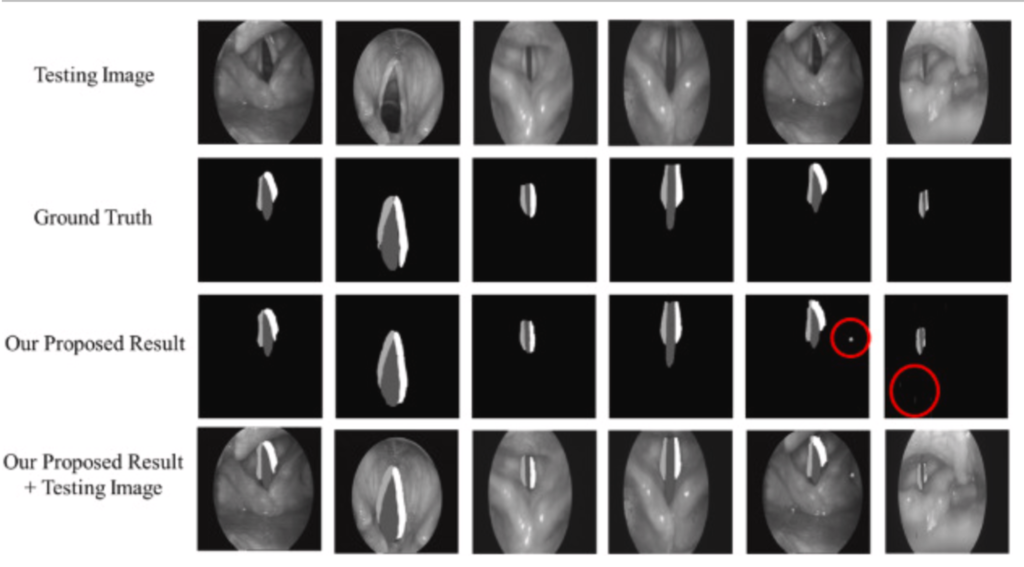
Fig. 4 Result of segmentation using 3D VOSNet (noises are marked with red circles): the first row represents the testing images; the second row represents the ground truth; the third row represents the segmenting result after 3D VOSNet output; the fourth row represents the segmenting result with testing images after 3D VOSNet output.
Testing dataset has 12800 images to verify the accuracy of object segmentation, and relevant indicators of the confusion matrix are calculated as indicators for evaluating the system, as shown below. The units in the table refer to the number of images in the testing dataset. The testing accuracy rate is 92.67%.
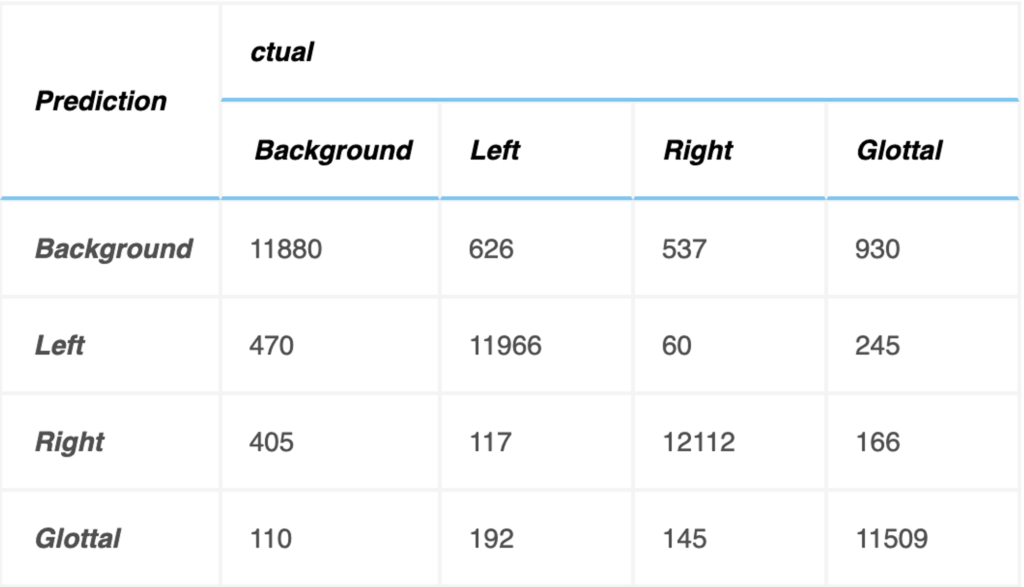
The relevant indicators are calculated by the confusion matrix in the table above to evaluate the experimental results, as shown in Fig. 5. The 3D VOSNet model proposed in this paper has a test accuracy of 93.48%, 94.63% and 89.91% in the parts of the left vocal cord, right vocal cord, and glottal segmentation, respectively. Therefore, it is known from experiments that the 3D VOSNet model has high segmentation accuracy. At the same time, we found that the segmentation results of our proposed method to the left and right vocal cord regions are slightly better than the segmentation results of the glottal. This may be caused by the glottal being blocked when the vocal cords vibrate, so the model misjudges the position of the glottal during segmentation. As for precision, the left vocal cord, right vocal cord, and glottal are 94.73%, 94.09%, and 89.86%, respectively, which means that the model can effectively obtain the position of the vocal cords, glottal, and its corresponding category. In terms of sensitivity performance, this model has a performance of 93.85%, 95.42% and 90.86% on the three regions of the left vocal cord, right vocal cord, and glottal, which shows that it has high sensitivity and can correctly mark these three regions out them. Finally, the specificity performance of this model is 92.99%, 93.80%, and 88.89% for the left vocal cord, right vocal cord, and glottal, respectively, which shows that it can segment these three regions of the larynx quite well.
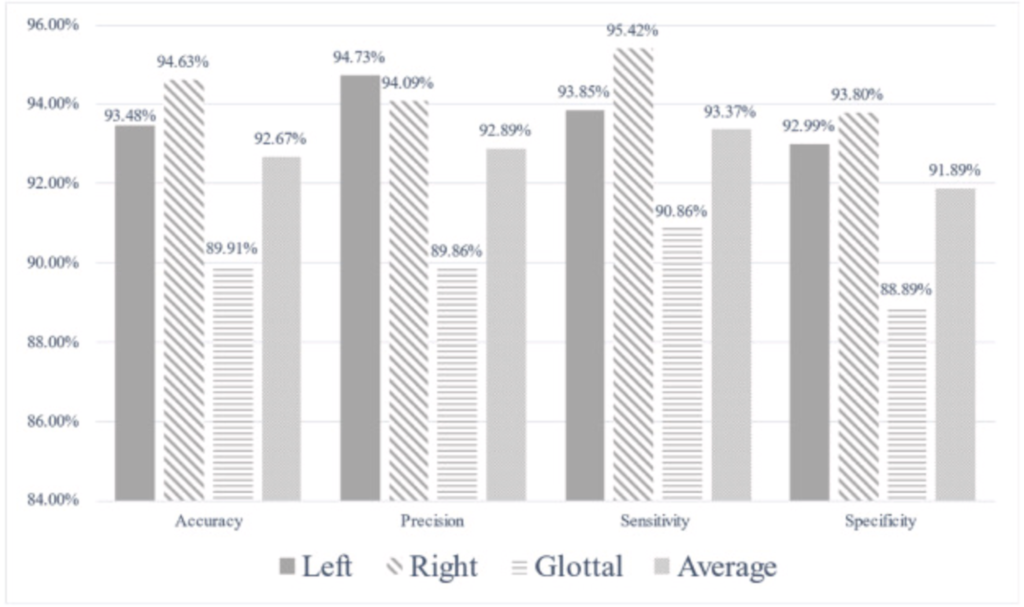
Fig. 5 Bar graph of indicators calculated with confusion matrix.
Optimization
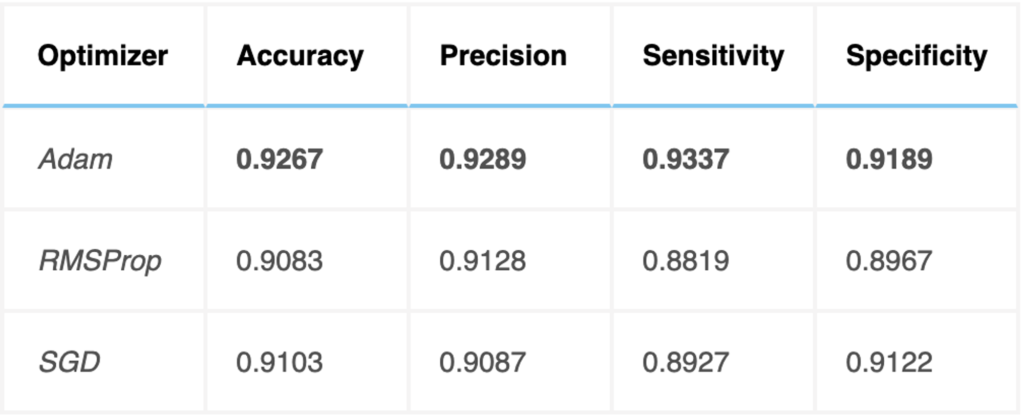
The Adam optimizer was used for training the 3D VOSNet. To evaluate the classification effectiveness of this optimization method, the results were compared with those of other efficient optimization methods, such as RMSProp and SGD, as shown below. The Adam optimizer was found to provide efficient results.
Discussion
Segmenting video laryngoscopes using 3D VOSNet, defining the thorough six X-indicators of vocal cords and glottal, and getting visualized were performed to accomplish our objective to assist otolaryngologists with the clinical diagnosis. Consequently, it’s necessary to further compare the segmentation effect of the 3D UNet and Mask R–CNN [[34]] model that can be used in instance segmentation in video laryngoscopes, which was shown in Table 3, and Fig. 6.
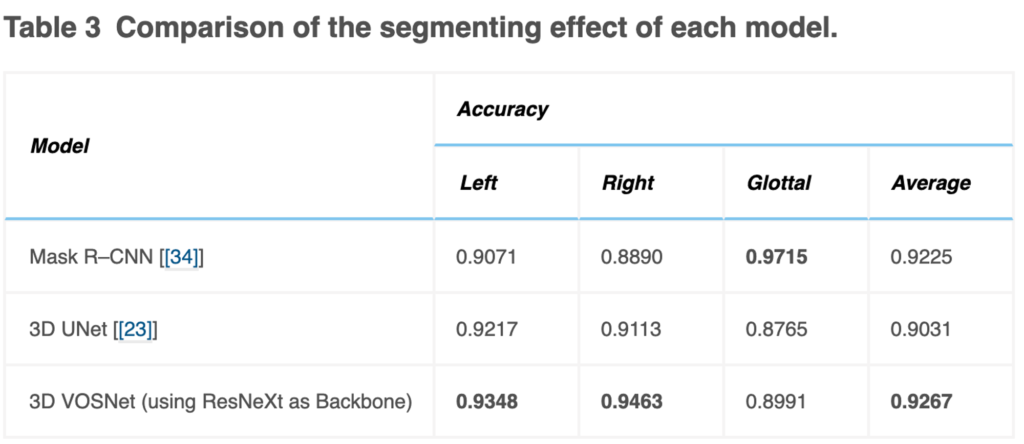
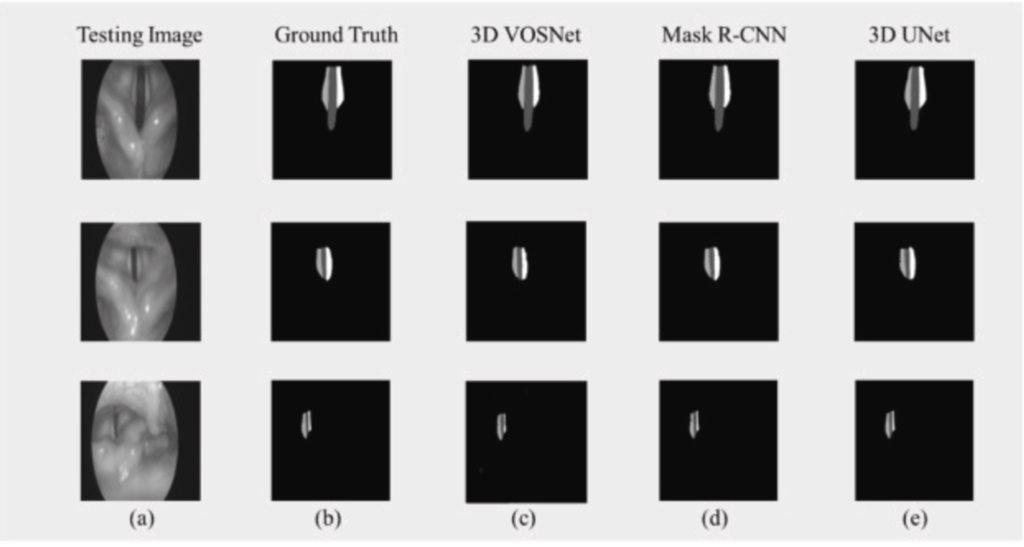
Fig. 6 Comparison of the segmenting result of each model using the same dataset: (a) Testing Image, (b) Ground Truth, (c) 3D VOSNet, (d) Mask R–CNN, and (e) 3D UNet.
The testing accuracy rate of Mask R–CNN in sequence images gets lower than that of 3D UNet and our proposed method in this paper. The video laryngoscopes contain a sequence of images, and the vocal cords vibrate rapidly so that the contextual information of 3D UNet and our proposed method can retain the characteristics of translation and occlusion invariance. On the other hand, the Mask R–CNN model does not have the characteristics of contextual information. If vocal cords move quickly, the effect of segmentation is likely to be poor. However, the effect of segmentation using 3D UNet is inferior to our proposed method. It is speculated that the possible reason is that the backbone was adopted ResNeXt in the paper, which can be used to extract multi-scale features. Therefore, using 3D VOSNet can effectively segment the blur edges caused by rapid vibration and keep translation invariance and occlusion invariance.
The segmentation of the larynx objects of the laryngoscope and the analysis and ranking of various indicators have been completed in this paper. The additional task is underway to analyze the reliability of the indicator input into the 1D signal analysis model so that the probability of having the disease or the recommendation of the related treatment plan can help doctors diagnose the disease and communicate with patients more effectively.
Conclusion
In this paper, 3D VOSNet is used to segment the left and right vocal cord regions and glottal region in endoscopic images of the video laryngoscope and uses the segmented left and right vocal cords and glottal to define X-indicators to assist otolaryngologists in diagnosing unusual vocal cords, proving the practicability to medical technology. In the segmentation part, the 3D VOSNet accuracy rate can reach 92.67%. The experimental results prove that 3D VOSNet has the ability to process time-series images. It retains the before and after feature information of the time-series images, so this model can accurately segment whole image into three areas being the left and right vocal cord, and glottal. Simultaneously, because of the feature information of the time-series images, the segment results will not be affected by external factors during laryngoscopy, so as to accomplish occlusion and translation invariance. Moreover, through the six larynx indicators (X-indicators) can provide objective and credible analysis for otolaryngologists. These interpretable indicators can assist doctors in diagnosing laryngeal lesions such as vocal cord paralysis and explaining clinical symptoms of the larynx to patients. Future work includes actually running the proposed system with automatic segmentation and comprehensive indicators in the hospital environment to effectively improve the efficiency of clinical diagnosis, substantially enhancing health care quality as well as sufficiently remedying the shortage of software that assists otolaryngologists in detecting the diseases with the laryngeal-related indicators in domestic ENT Clinics.
My Contribution
Contributed reagents, materials, analysis tools, or data
Wrote parts of the paper
Debugged the code when experiments weren’t working